I love a good star chart. Maybe because I got started with astronomy and astrophotography with visual observation and a box full of star charts when I was in high school, and I’ve never really found digital planning as satisfying as laying out a physical chart on a table. But that’s not what this post is about.
What it’s about is that I want to generate star charts for this website based on my images, mostly because it seems like an interesting problem, and because I want to control the aesthetics of the charts, which means they need to be in SVG (or otherwise stylable). So, this requires two things, first to plate solve the image, and second to use that information to generate the chart.
ASAP, the Astrometric STAcking Program is a fantastic tool for offline plate solving, and my tools (like N.I.N.A) already use it. ASTAP, when invoked from the command-line, can take an image file, and plate solve it for a given FOV and search radius. For my latest Orion Nebula, it gives the following output:
$ /Applications/ASTAP.app/Contents/MacOS/astap -r 180 -fov 0 -f orion_nebula.jpg
Solution found: 05: 35 04.6	-05° 17 54	 Solved in 19.2 sec.	 Δ was 83.8d.	 Used stars down to magnitude: 12.7
Warning inexact scale! Set FOV=1.71d or scale=1.9"/pix
This gives me the RA, DEC, and FOV of the iamge (if you use -fov 0 to have ASTAP automatically solve that as well — since this is a final image over two sessions, with cropping, the FOV isn’t necessarily going to match exactly what my Canon 6DM2 and AT115EDT provide).
Next, I’ve discovered a tool that generates some really nice star charts in Dominic Ford’s StarCharter used for the charts on in-the-sky.org. StarChater takes a configuration file for the chart to generate. What I wanted to see is if I could take the coordinates that ASTAP returns and put them into a configuration file for StarCharter:
CHART
title="Great Orion Nebula"
output_filename=test.svg

# RA and DEC as decimals
ra_central=5.5844
dec_central=-5.2981

# Go about twice as wide as the image FOV, give some context
angular_width=4

aspect=1.5
ra_dec_lines=1
axis_label=0
mag_min=7
constellation_boundaries=1
constellation_sticks=1
coords=ra_dec
projection=gnomonic
star_names=1
star_flamsteed_labels=0
constellation_names=1
plot_galaxy_map=1
plot_equator=1
plot_ecliptic=1
plot_galactic_plane=1
font_size=1.2
magnitude_key=0
great_circle_key=0
dso_symbol_key=0
And then run it:
starchart.bin test.sch
This gives me a star chart that corresponds to the image:
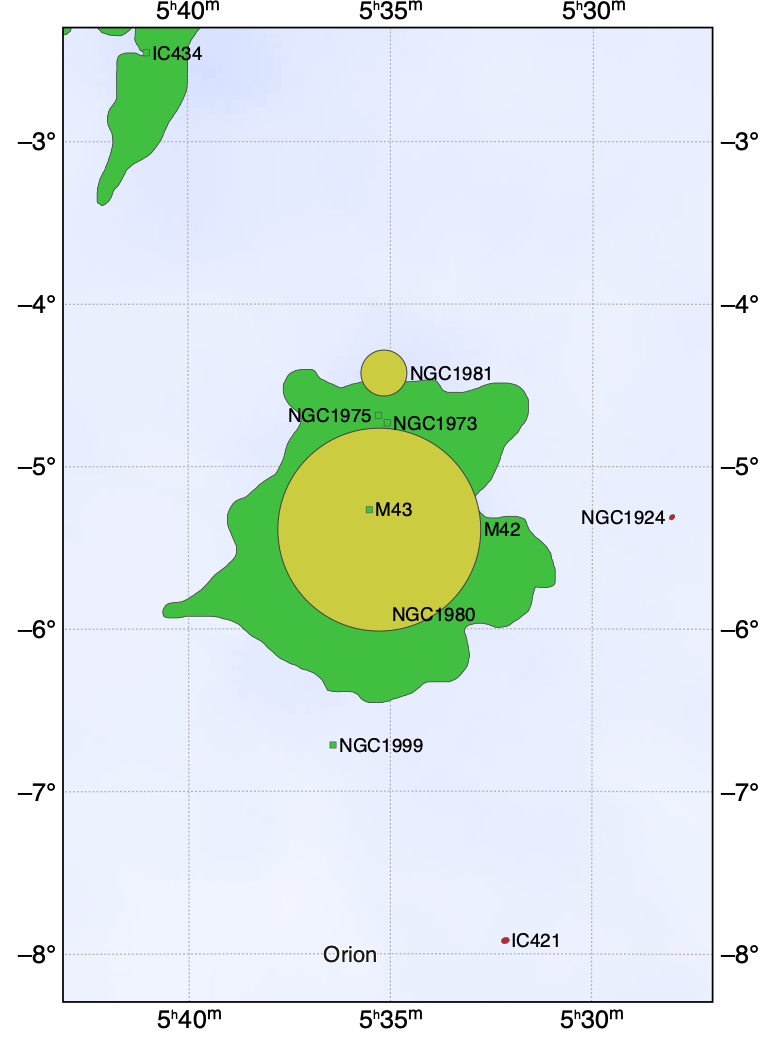
I’m going to wrap this up with some automation and I’d like to have it as part of my workflow and my astrophotography gallery.
As a minor aside, ASTAP can also add annotations to the image, with the -annotate argument. I’m not sure I’ll use this, but it’s a neat discovery with… possibilities.